Smart Water project in Valencia to monitor Water Cycle Management
The history of human beings is closely tied to water. Fresh water has been a key factor in the emergence of civilizations, not only for direct human consumption but also for agriculture and animal husbandry. The growth of communities and their increasing dependence on a steady water supply led to the creation of primitive waterworks to ensure that supply. The great civilizations of the ancient world all sprung up around abundant water supply. Rivers were vital to irrigation and the growth of commerce. Much later, industrialization and its expansion were also dependent on water supply and the use of waterways.
Mankind has been clever and creative with respect to the use of water, but also the cause of its contamination and shrinking availability. Worldwide, falling groundwater levels, disastrous droughts and calamitous floods are increasingly attributable to human activity, and deteriorating water quality is directly so.
Although every living organism on earth is dependent on water, humans use it far in excess of their survival needs. Fresh water from reservoirs and wells is used for countless purposes, and water consumption is constantly expanding. In the past century alone, total worldwide water consumption increased six times.
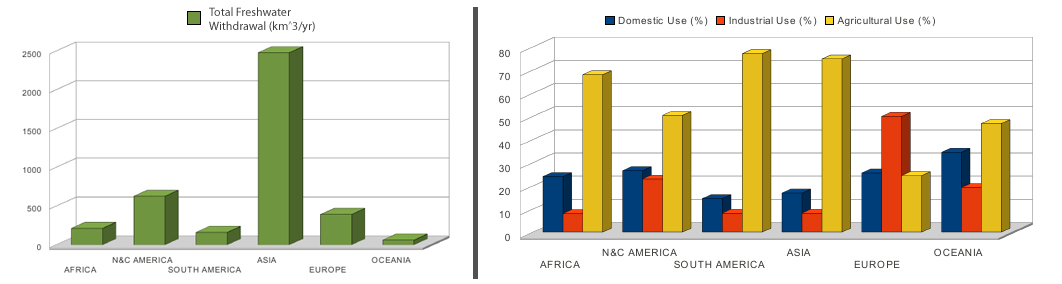
Fig. 1.- a) Total Freshwater withdrawal by region b) Freshwater use by sector and region (Both 2010 updated)
Integrated Water Cycle Management is a way for local water utilities to sustainably manage their water systems to maximize benefits to the community and environment. This cycle starts with precipitations that allow rivers, lakes or reservoirs to contain water. Next, this water is treated and stored for later domestic or agriculture use. Finally, water is treated to be purified before being returned to the environment.
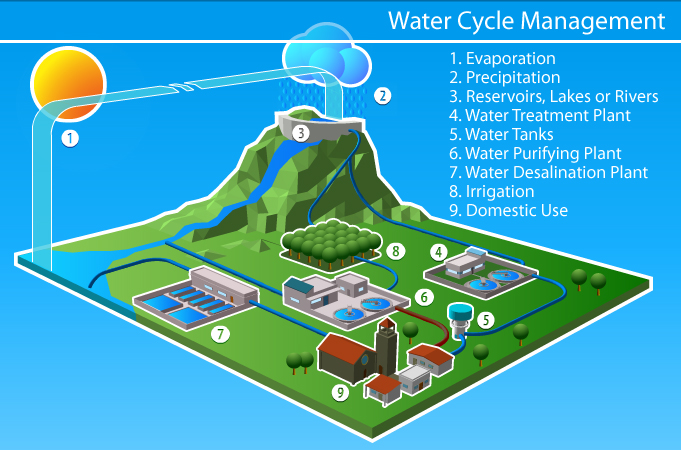
Fig. 2.- Integrated Water Cycle Management
Water cycle is vital for any city so it must be monitored in order to assure a perfect system performance. The network of sanitary sewers of a city manage the disposal and stormwater harvesting, and the transport, control and treatment of wastewater. This system must work perfectly and it must be able to react against unexpected situations in order to minimize the economic losses produced by natural disasters such as floods.
Wireless Sensor Networks (WSN) can help to monitor environmental conditions and water quality, allowing an easier, faster and cheaper data logging, which will lead into a better utilization of resources of each organization or government.
PRETESIC Project
PRETESIC project has been developed by the Institute of Computer Technology (ITI) in collaboration with the Polytechnic University of Valencia (UPV) and Telefonica Cathedra, and it has been deployed in the city of Valencia (Spain). This system is able to monitor water quality by measuring different environmental parameters and its main advantage is to minimize the time required to deploy a wireless sensor network in a particular area. These kind of networks are known as Quick Deployment Sensor Networks (QDSN).
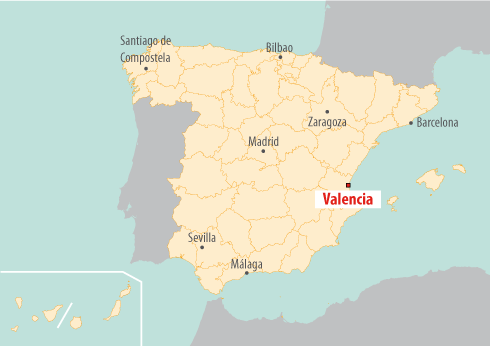
Fig. 3.- Project location
PRETESIC is aimed at monitoring Valencia’s network of sanitary sewers in real-time to determine the quality of water and thus, establish whether elements within the network are working properly. In this way, the system is able to react against unexpected situations, avoiding possible damages that natural disasters such as floods usually provoke in cities.
One of the main advantages of this project is to allow the deployment of a wireless sensor network in an easy and affordable way in any part of a city. Other kind of systems should require an study about the area where the network is going to be deployed. However, PRETESIC allows to deploy the sensor nodes anywhere and start to receive data immediately.
On the one hand, these sensor nodes have been used to measure water parameters such as PH, temperature, conductivity or redox, which allow to determine water quality and check whether the different processes within water cycle are working properly. On the other hand, this system allows to detect possible engines or water pumps problems, preventing them from stopping and saving a huge amount of money.
The solution
This project can be better explained with the following diagram:
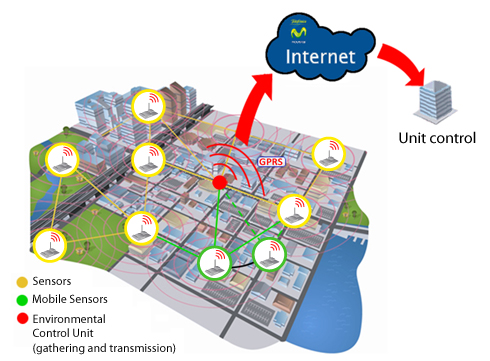
Fig. 4.- Solution diagram
PRETESIC nodes use Waspmotes and are able to measure different parameters:
- Temperature
- PH
- Conductivity
- Redox
- Turbidity
- Chemical Demand of Oxygen (D.Q.O.)
- Ammonia
- Toroids to measure energetic efficiency
These sensors are connected to Waspmote through the Proto Sensor Board, which contains the electronics needed to implement an easy hardware integration of these sensors.
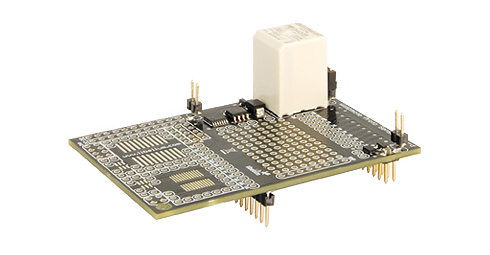
Fig. 5.- Waspmote Proto Sensor Board
PRETESIC nodes are able to measure from up to three 4-20mA sensors thanks to the integration done over Proto Sensor Board. Figure 6 shows an internal view of these nodes.
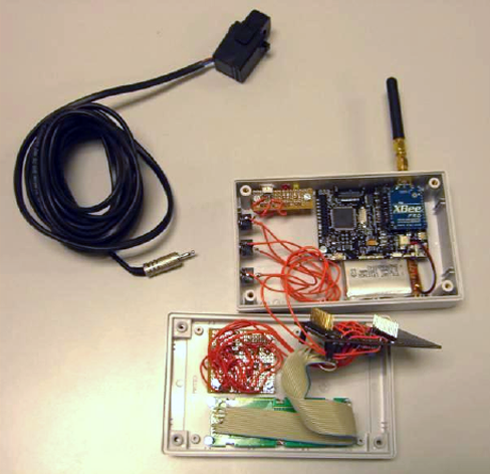
Fig. 6.- PRETESIC node using Waspmote and Proto Sensor Board
The main characteristics of these nodes are:
- Each node has a LCD screen and a control panel to display the measurements, use the fast deployment sensor tools and configure the nodes. These features let any worker deploy the network in an easy way and with no previous planning.
- Battery life up to 1 week (up to months if panel solar is used).
- These nodes accept any type of sensor (configuring the node previously).
In order to know where this sensor is located, each Waspmote can integrate a GPS, that delivers accurate position and time information.
Libelium offers several wireless modules for the radio communication:
|
Model |
Protocol |
Frequency |
TX power |
Sensitivity |
Range* |
|
XBee-802.15.4 |
802.15.4 |
2.4 GHz |
1 mW |
-92 dB |
500 m |
|
XBee-802.15.4-Pro |
802.15.4 |
2.4 GHz |
63 mW |
-100 dBm |
7000 m |
|
XBee-ZigBee |
Zigbee-Pro |
2.4 GHz |
2 mW |
-96 dBm |
500 m |
|
XBee-ZigBee-Pro |
Zigbee-Pro |
2.4 GHz |
50 mW |
-102 dBm |
7000 m |
|
XBee-868 |
RF |
868 MHz |
315 mW |
-112 dBm |
12 km |
|
XBee-900 |
RF |
900 MHz |
50 mW |
-100 dBm |
9 km |
|
XBee-XSC |
RF |
900 MHz |
100 mW |
-106 dBm |
9 km |
Fig. 7.- Distances reached depending on the protocol
So we can reach up to 12 km with Line of Sight (LOS) condition using the 868MHz module. It is also possible to transmit the data via GPRS/3G, as a secondary radio module for better availability and redundancy in situations when it is critical to ensure the reception of the message. The GPRS/3G module is quad-band (it can operate in 4 different bands, so it supports any cellular connection provider), making it able to work all over the world, therefore this project we are describing is suitable for any country.
One of the main characteristics of Waspmote is its low power consumption:
- 9mA, ON mode
- 62uA, sleep mode
- 0.7uA, hibernate mode
Waspmote is sleeping most of the time, in order to save battery. After some minutes (programmable by the user), Waspmote wakes up, reads from the sensors, implements the wireless communication and goes again to sleep mode. Each device can be powered with rechargeable batteries and a solar panel, making the system very autonomous.
Deployment process
Because one of the main features which would provide PRETESIC system was the ease to deploy a wireless sensor network anywhere, each node was provided with a remote setting. Thus, each node can be configured remotely and the sensor from which it is going to measure can be modified. All of this, in a graphic and simple way, so that a worker without any special skills could pull it off.
One of the characteristics of these nodes is that they are endowed with an HMI to see whether the node has radio coverage. This screen also provides information about the sensor connected to the node as we can see in Figure 8.
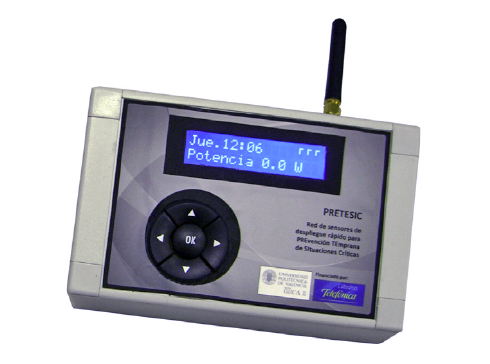
Fig. 8.- PRETESIC node
The deployment process for this project is different from other projects in which the nodes have a fixed location. In this case, PRETESIC system can be installed anywhere during some hours and then move to another part of the city to measure again.
Figure 9 explains the deployment process is carried out every time a new area wants to be covered by PRETESIC system.
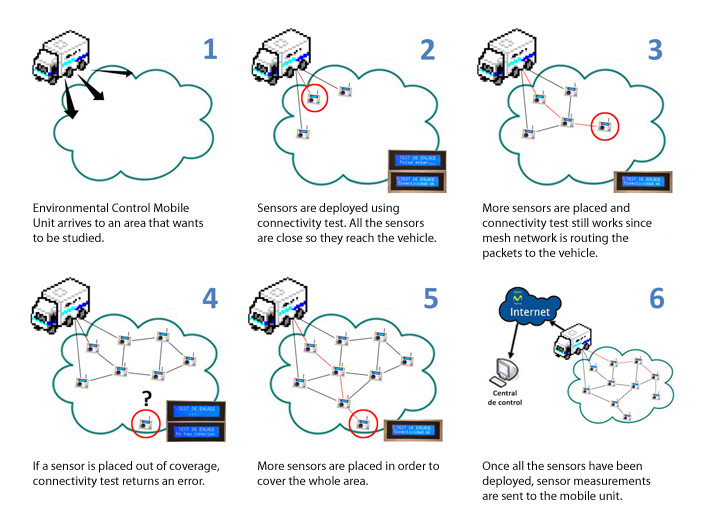
Fig. 9.- PRETESIC process to deploy a network
Once the network has been deployed, the mobile unit starts to receive data. These data are sent over the Internet to a remote server which stores and treat them. At the same time, workers, who are receiving data in real-time in the mobile unit, can see these data on their screens thanks to a powerful software. Thus, workers can know whether the data received are correct or there is a problem in the measurement. Figure 10 shows an example of several graphs generated in the mobile unit.
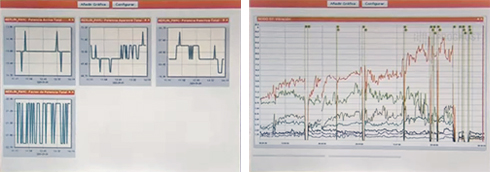
Fig. 10.- PRETESIC software to analyze measurements
As a result of this project, water quality and water cycle can be monitored in real-time in order to check that all the elements within the network of sanitary sewers are working properly and to be able to react against an unexpected situation. Therefore, a huge amount of money can be saved by minimizing the effects of a natural disaster and preventing parts of the water cycle from breaking.
If you are interested in Waspmote, we will be glad to help you to design your system. You can request for a quotation of Waspmote here.
More information about the project and its deployment can be seen in the following video:
Discover our IoT Kits at The IoT Marketplace!
The IoT
Marketplace
Buy off-the-shelf
IoT kits