
Smart Tourism & Crowd Monitoring: How La Unión Built its “Digital Brain”
Discover how La Unión (Murcia) uses Libelium’s IoT technology and iris360 to lead the way in...
Combine Smart Spot Crowd and iris360 to transform anonymous visitor signals into reliable insights about occupancy, dwell time, routes and movement patterns.
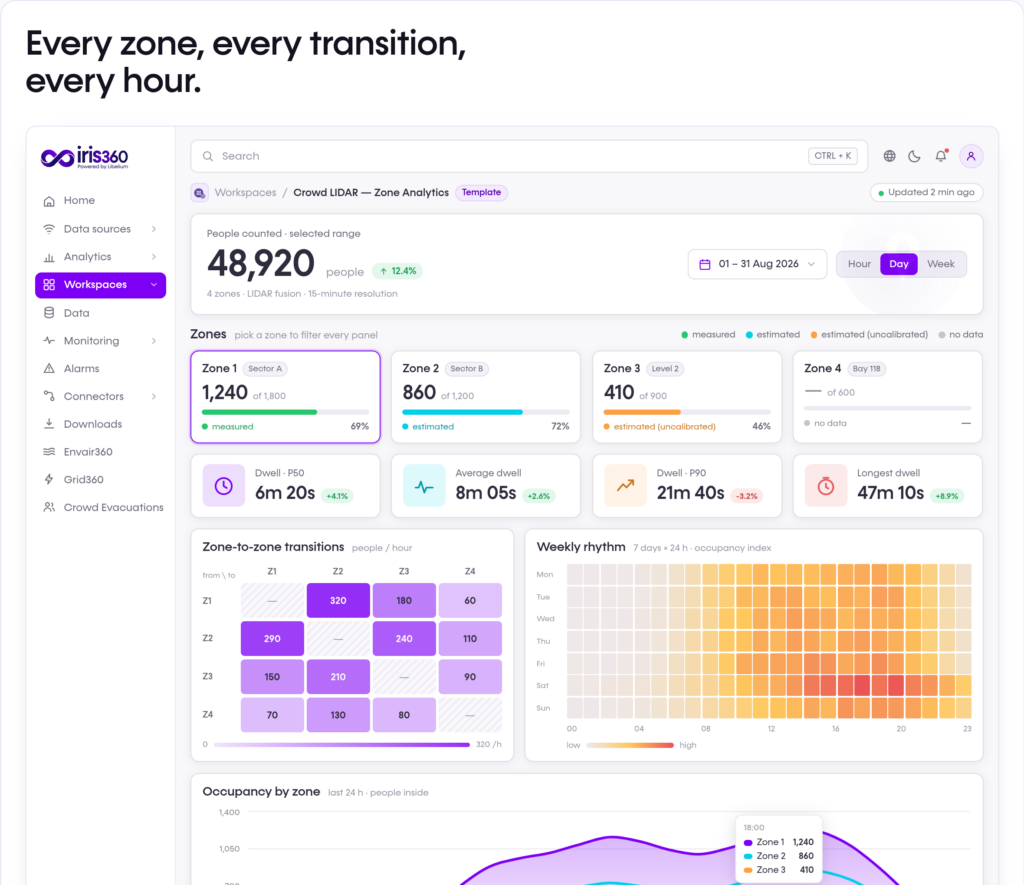
Turn anonymous device detections into actionable insights about occupancy and mobility. Smart Spot Crowd reveals how busy a location is, how visitors move between monitored areas and which routes are used most—without capturing images or identifying individuals.
Water, Agriculture, Weather, Noise, Environmental parameters
Automatic sensor detection, Local processing & storage, No-code configuration, 4 sensor connections, Battery, mains or solar
LoRaWAN, 4G
iris360, Microsoft Azure, AWS, Other platforms via HTTPS / MQTT
Detects anonymised Wi-Fi/Bluetooth signals from nearby devices.
Devices transmit continuously over the right network for the site.
Aggregates and contextualises visitor data into a trusted layer.
Occupancy, flows, dwell time and behavioural patterns, visualised.
Dashboards and alerts reach place managers and city teams.
Detects anonymised Wi-Fi/Bluetooth signals from nearby devices.
Devices transmit continuously over the right network for the site.
Aggregates and contextualises visitor data into a trusted layer.
Occupancy, flows, dwell time and behavioural patterns, visualised.
Dashboards and alerts reach place managers and city teams.
The real value lies in understanding behaviour. Knowing how many people visit a location is useful.
Understanding how they behave is transformational — how long they stay, where they move next, and which routes are most popular.
Passively detects Wi-Fi and Bluetooth signals emitted by nearby smart devices, without requiring users to connect to a network or install an application.
Device identifiers and collected metadata are immediately obfuscated before transmission, preventing the original information from being recovered or linked to an individual.
Count mode measures the devices present over time, while Track mode provides the anonymised detections and metadata needed to analyse movement between locations.
Combines passive Wi-Fi and Bluetooth scanning to capture a broader and more representative view of the devices present in the monitored area.
No results match your search.

Configurable filtering removes detections based solely on randomised MAC addresses when they would distort the analysis, improving the relevance of the resulting dataset.
Detection and filtering parameters can be configured according to the deployment, allowing the device to support occupancy counting or multi-location mobility analysis.
A professional, flame-retardant enclosure and an industrial real-time operating system provide a robust foundation for long-term deployments.
Integrated health monitoring, watchdog mechanisms and optional power backup help maintain operation during outages, faults or unauthorised manipulation.
No results match your search.
Occupancy & Visitors
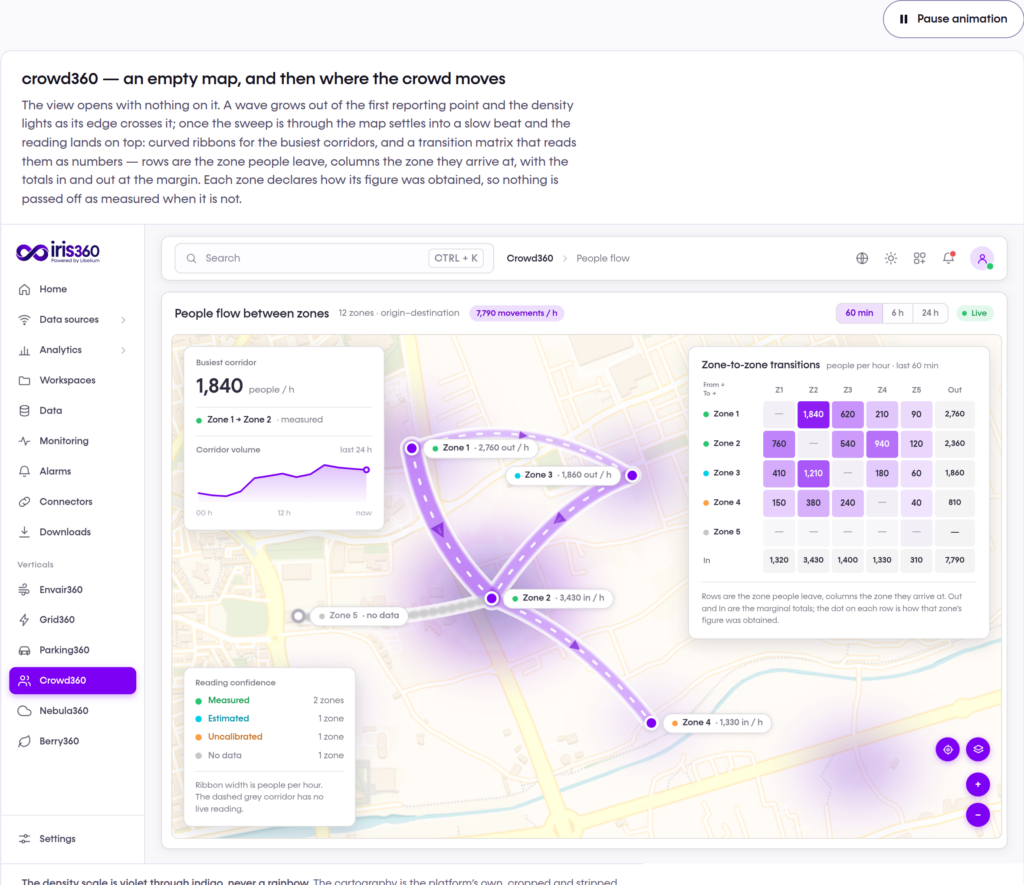
Track detected activity and occupancy patterns with spatial context, switching between the general map, the heatmap and the floor-plan view.
Crowd Monitoring overview.
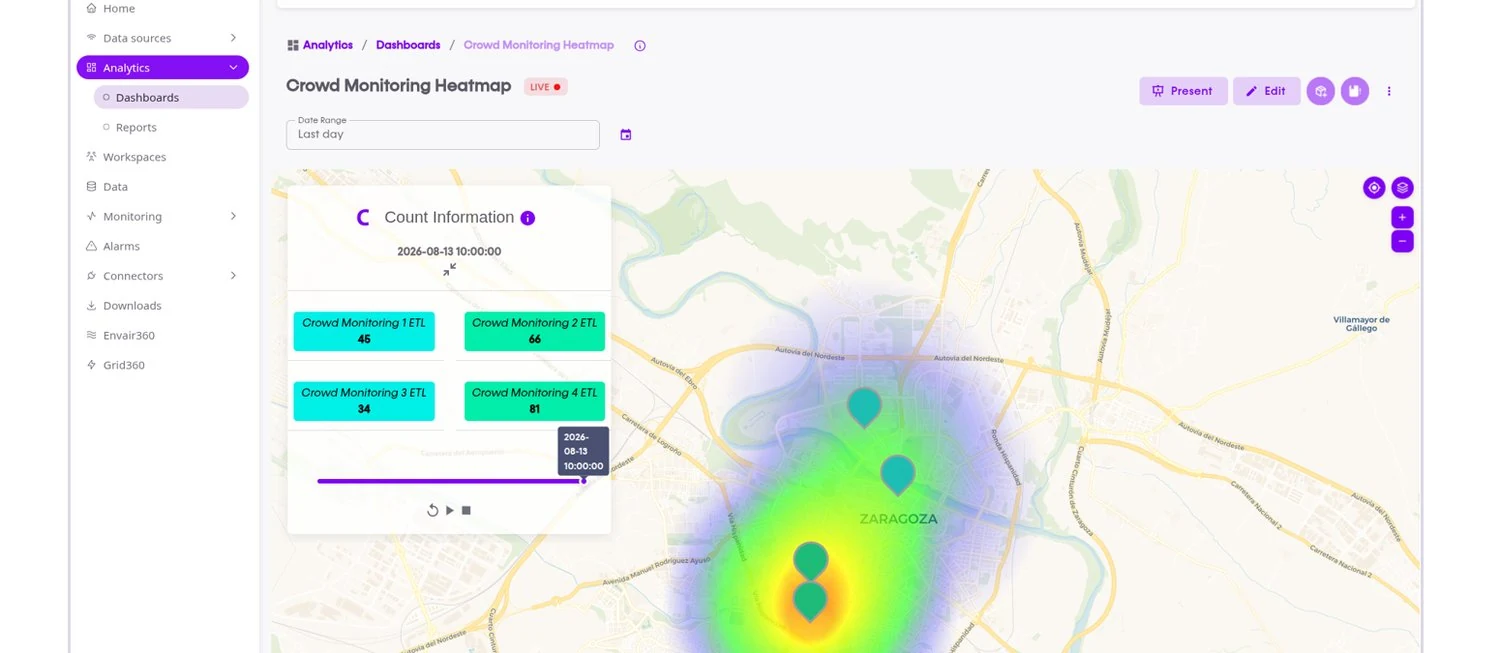
Heatmap on a map.
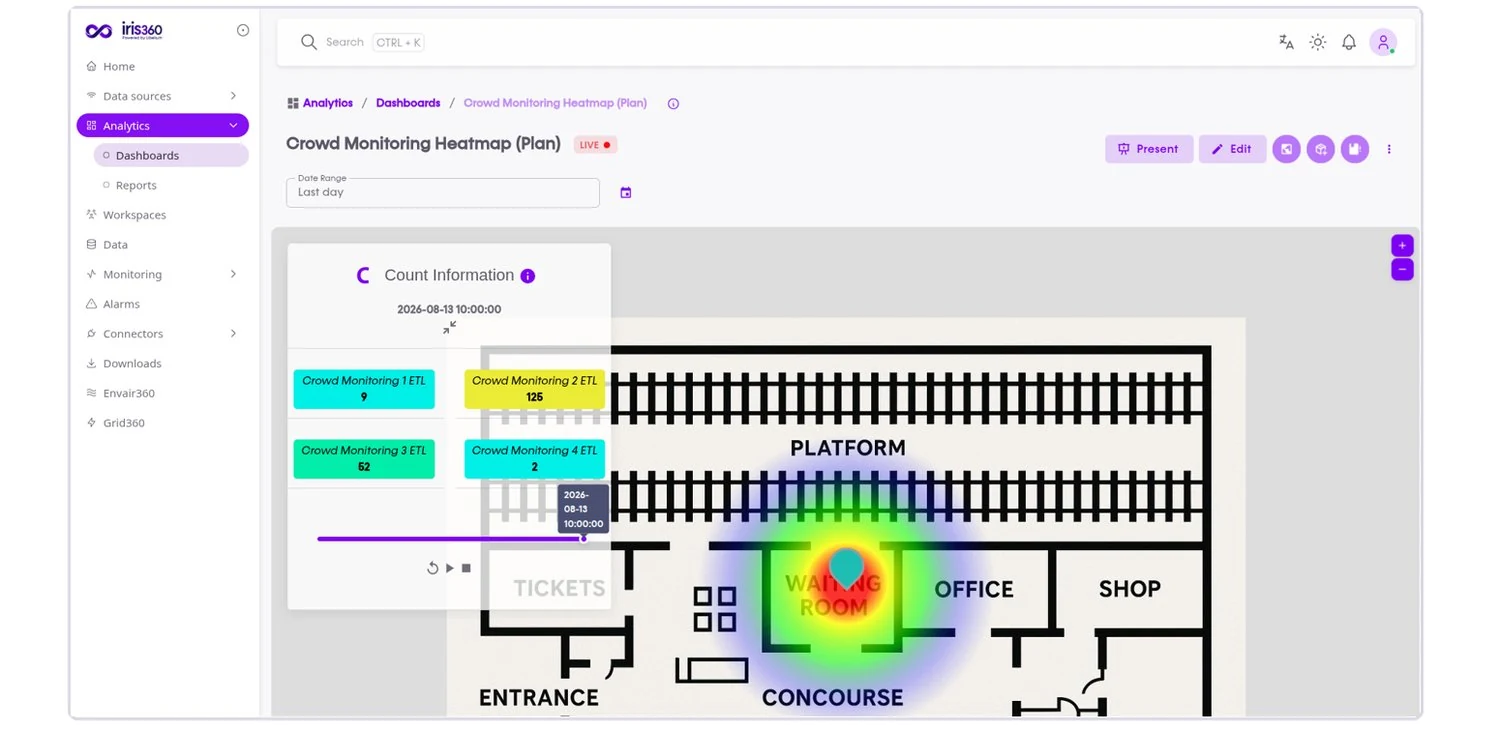
Heatmap on a floor plan.
Flows & Routes
Show transit flows and relationships between monitored locations, on a map or a floor plan according to the deployment context.
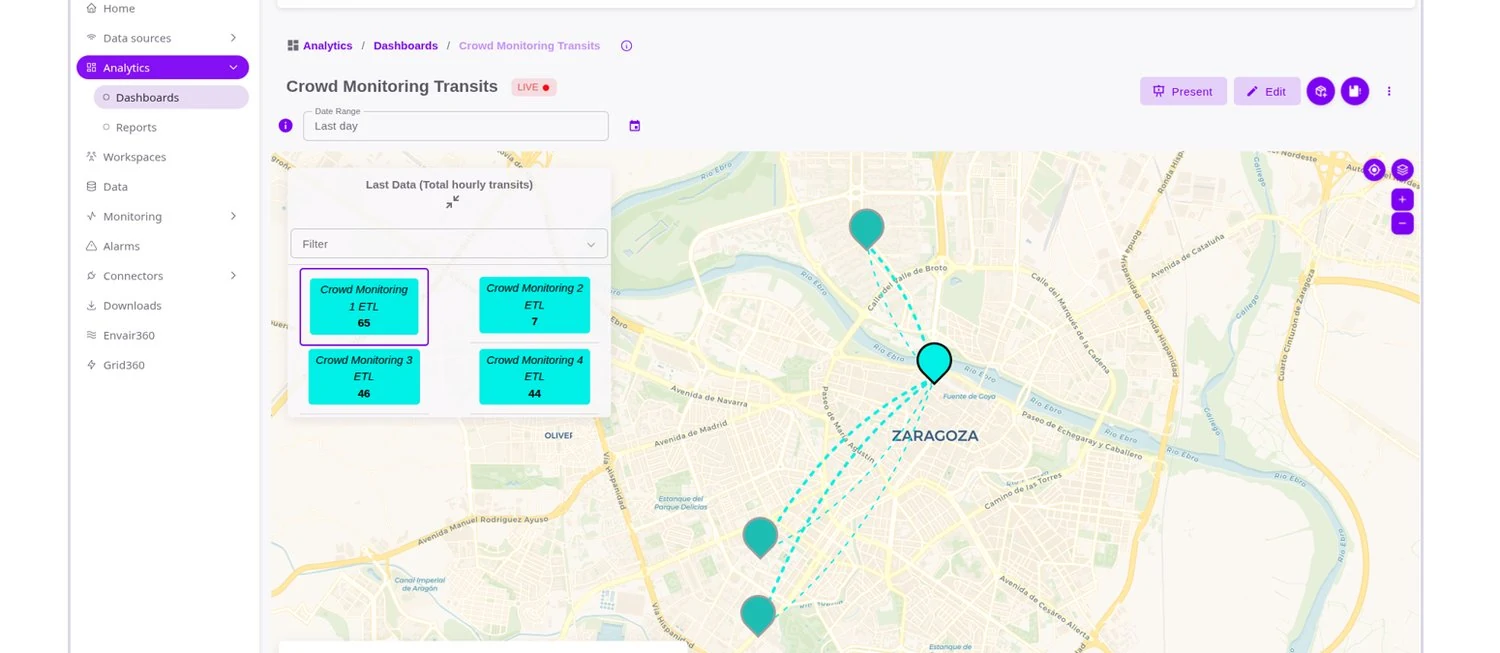
Transits and relationships between points on a map.
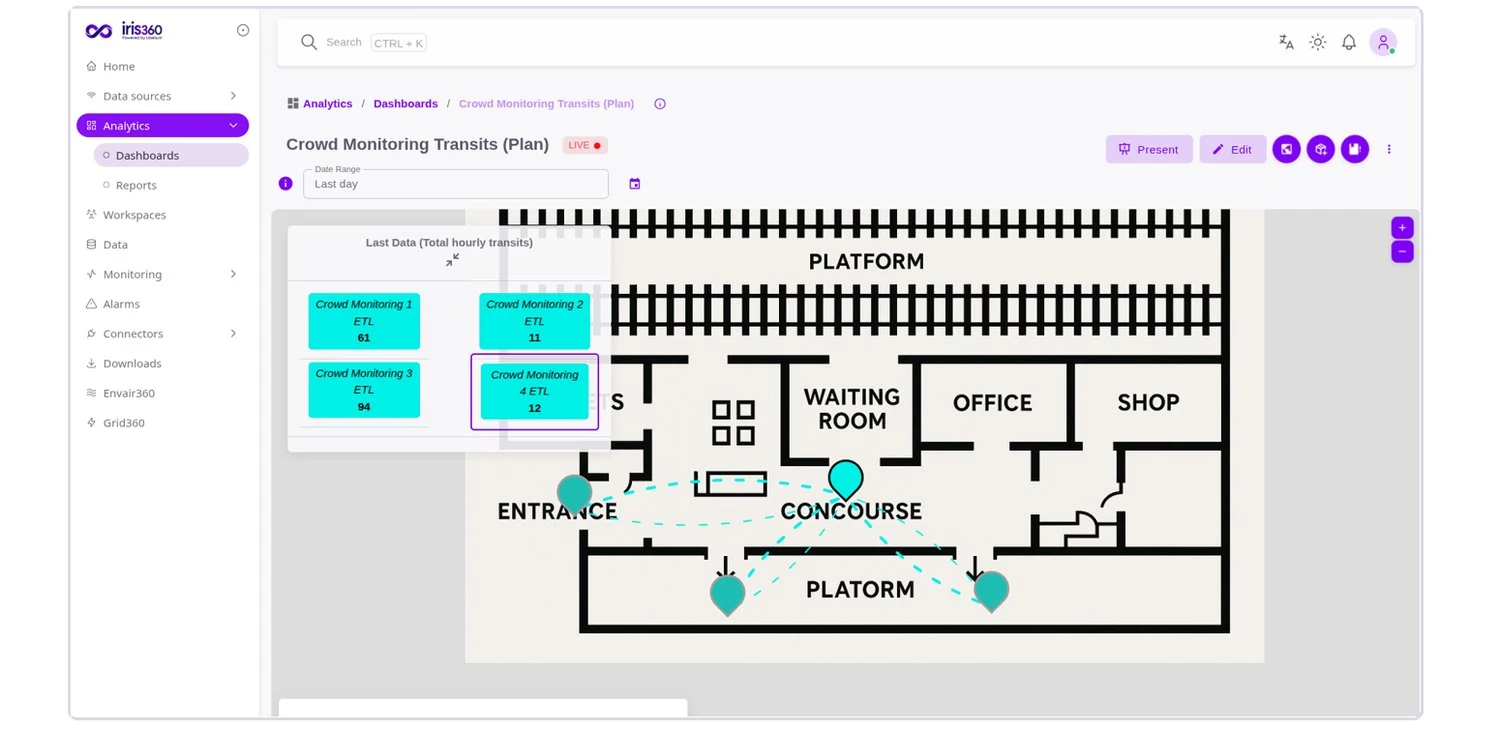
Transits on a floor plan.
Origin–Destination
Read origin–destination relationships between monitoring points from the same transit dataset.
Transits and relationships between points on a map.
Transits on a floor plan.
Visitor Classification
Classify visitor patterns as Tourist, Resident or Short-Term Visitor and see how they are distributed spatially. It classifies behaviour patterns, not identified people.
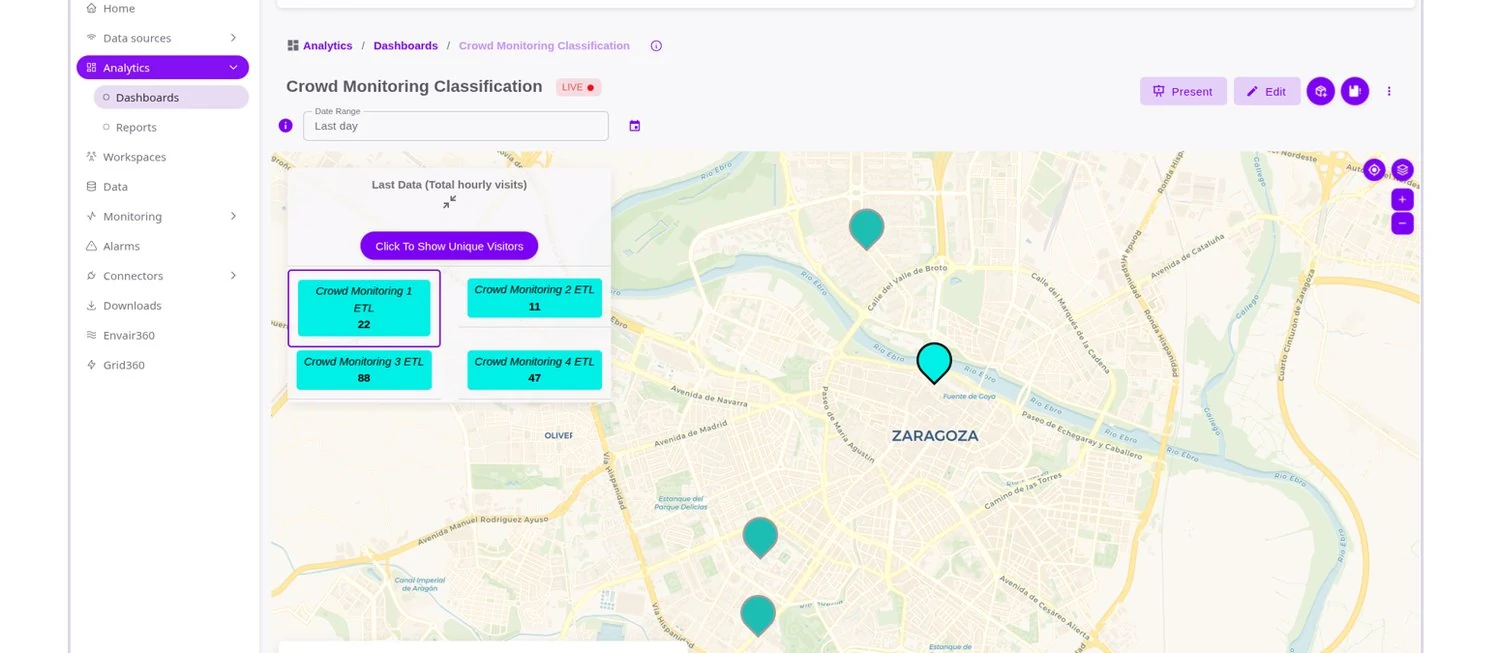
Pattern classification on a map.
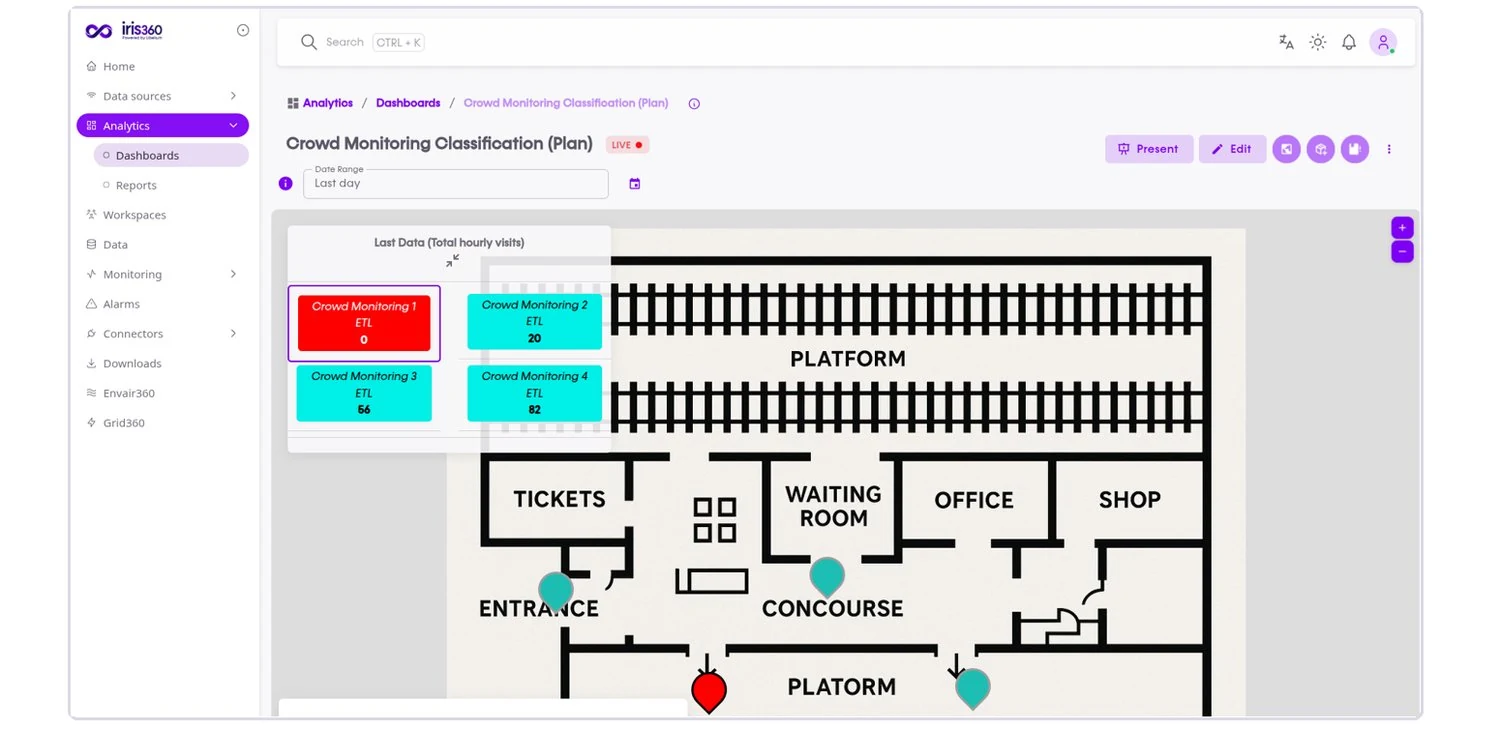
Classification on a floor plan.

centralises Crowd Monitoring data and turns device detections into visitor and mobility intelligence through dashboards, maps, plans and analytical views.
Deploying iris360 does not require replacing existing hardware or wireless sensors. Our open FIWARE NGSI-LD models, REST and MQTT ingestion pipelines connect directly to legacy devices, giving you unified operational dashboards from day one.
Engineered for cities, event managers and transport authorities managing large human flows.
Protecting narrow heritage corridors and plazas from unmanageable overcrowding bottlenecks.
Turnstile flow velocity monitoring and perimeter bottleneck alerts before kickoff or encore.
Passenger queue velocity analytics and security line dispatch optimization.
Rapid detection of crowd surges, localized crush hazards, and emergency corridor blockages.
No results match your search.
No results match your search.
Discover how La Unión (Murcia) uses Libelium’s IoT technology and iris360 to lead the way in...

The Smart Spot system helps protect Golden Bay, Malta, by controlling tourist influx and preserving its...

The Smart Spot system helps protect Golden Bay, Malta, by controlling tourist influx and preserving its...
Protected-zone permitting, existing CCTV counting reuse, event-mode surge configuration, and multi-authority data governance. We design the deployment around your site.
Anonymous aggregate counting with DPIA support and zero PII capture, validated against local data-protection authorities.
Integrate current CCTV-based counters and access turnstiles into one iris360 occupancy and flow model.
Pre-configured capacity thresholds and alerting profiles for festivals, processions, and peak-season operations.
No results match your search.
Libelium works with organizations that need more than a standard deployment. Our team can help you integrate existing systems, define data governance, connect with interoperable platforms and design a solution adapted to your operational, regulatory and business context.



Understand how people engage with your spaces, optimise operations and services with reliable insight based on real behaviour.
 English English English
  Español English English English Español