A clean air supply is essential to our own health and that of the environment. But since the industrial revolution, the quality of the air we breathe has deteriorated considerably – mainly as a result of human activities. The issue of air quality is still a major concern for many European citizens. It is also one of the areas in which the European Union has been most active. Since the early 1970s, the EU has been working to improve air quality by controlling emissions of harmful substances into the atmosphere, improving fuel quality, and by integrating environmental protection requirements into the transport and energy sectors. Waspmote has been used to control public transportation and monitor environmental parameters in several cities in Serbia.

World Health Organization (WHO) establishes that “the environment is a major determinant of health, estimated to account for almost 20% of all deaths in the WHO European Region”. Different analyses and reports have revealed that:
- Some 40 million people in the 115 largest cities in the European Union (EU) are exposed to air exceeding WHO air quality guideline values for at least one pollutant. Children living near roads with heavy-duty vehicle traffic have twice the risk of respiratory problems as those living near less congested streets.
- Indirect effects of air pollution, such as climate change, are becoming increasingly evident. Transport is the fastest growing source of fossil-fuel emissions of carbon dioxide (CO2), the largest contributor to climate change.
Italian National Institute of Statistics (ISTAT) presented an analysis of air quality in European cities for the 2004-2008 period using the European Environment Agency’s (EEA) AirBase database. Elementary data from urban background stations were combined into a single indicator – the average number of times that legally-defined concentration limits were exceeded.
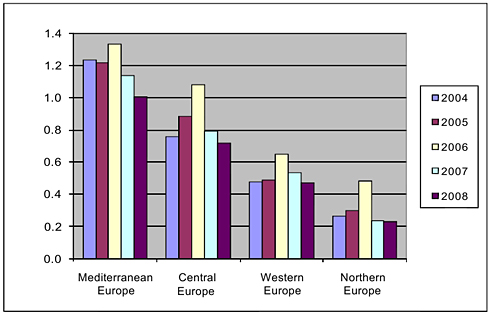
Fig. 1.- Summary air quality indicator by European Macro-Region
As it can be concluded from the different reports and analyses, air quality is improving though in some regions it is still far from a healthy value. For this reason, monitoring environmental parameters is vital to understand where the main pollution points are and try to reach an appropriate value in each city.
EkoBus Project
EkoBus system has been developed in collaboration with Ericsson, which has been deployed in the cities of Belgrade and Pancevo. The system utilizes public transportation vehicles to monitor a set of environmental parameters over a large area as well as to provide additional information for the end-user like the location of the buses and estimated arrival times to bus stops.
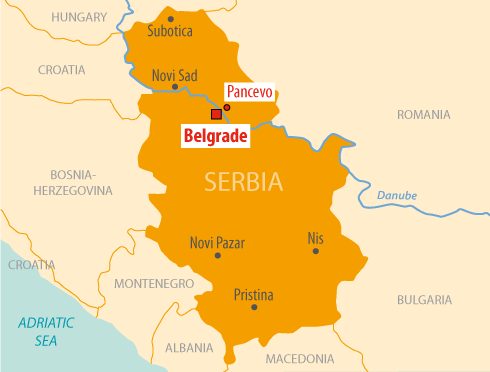
Fig. 2.- EkoBus location
EkoBus is framed within SmartSantander project. It proposes a unique in the world city-scale experimental research facility in support of typical applications and services for a smart city. This project is funded by the European Union through its Future Internet Research and Experimentation (FIRE) program. Project Consortium consists of different companies and Universities such as: Telefonica, Alcatel-Lucent, Ericsson, University of Cantabria or University of Surrey.
This unique experimental facility will be sufficiently large, open and flexible to enable horizontal and vertical federation with other experimental facilities and stimulates development of new applications by users of various types including experimental advanced research on IoT technologies and realistic assessment of users’ acceptability tests. The project envisions the deployment of 20,000 sensors in different European cities such as Belgrade and Pancevo (Serbia).
The solution
This project can be better explained with the following diagram:

Fig. 3.- Solution diagram
65 Waspmotes were deployed in two different locations; measuring 6 parameters:
- Temperature
- Relative humidity
- Carbon monoxide (CO)
- Carbon Dioxide (CO2)
- Nitrogen Dioxide (NO2)
- GPS location
These 5 sensors are connected to Waspmote through the Gases Sensor Board, which contains the electronics needed to implement an easy hardware integration of these sensors.
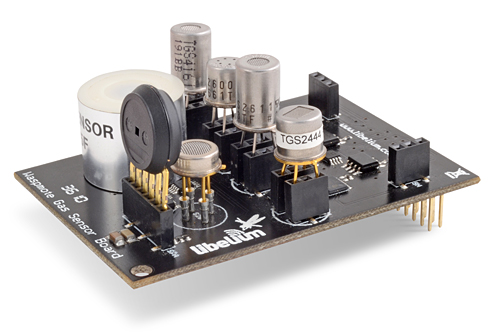
Fig. 4.- Waspmote Gases Sensor Board
The amplification stage of each sensor is trimmable, to allow a better integration of the specific sensor, as there can be variations from one sensor to another one of the same model. Moreover, this characteristic allows us to focus the accuracy of Waspmote in a region of interest. Besides, it is possible to switch each sensor on separately, as their power supply lines are independent and can be controlled by Waspmote in real time.
In order to know where this sensor is located, each Waspmote can integrate a GPS, that delivers accurate position and time information.
Libelium offers several wireless modules for the radio communication:
Model | Protocol | Frequency | TX power | Sensitivity | Range* |
XBee-802.15.4 | 802.15.4 | 2.4 GHz | 1 mW | -92 dB | 500 m |
XBee-802.15.4-Pro | 802.15.4 | 2.4 GHz | 63 mW | -100 dBm | 7000 m |
XBee-ZigBee | Zigbee-Pro | 2.4 GHz | 2 mW | -96 dBm | 500 m |
XBee-ZigBee-Pro | Zigbee-Pro | 2.4 GHz | 50 mW | -102 dBm | 7000 m |
XBee-868 | RF | 868 MHz | 315 mW | -112 dBm | 12 km |
XBee-900 | RF | 900 MHz | 50 mW | -100 dBm | 10 km |
XBee-XSC | RF | 900 MHz | 100 mW | -106 dBm | 12 km |
Fig. 5.- Distances reached depending on the protocol
So we can reach up 40 km with Line of Sight (LOS) condition using the 868MHz module. The high performance of Waspmote makes the readings really accurate and the transmission is highly reliable and flexible.
It is also possible to transmit the data via GPRS, as a secondary radio module for better availability and redundancy in situations when it is critical to ensure the reception of the message. The GPRS module is quad-band (it can operate in 4 different bands, so it supports any cellular connection provider), making it able to work all over the world, therefore this project we are describing is suitable for any country. Data are sent via GPRS in this project as the buses are moving all over the city.
One of the main characteristics of Waspmote is its low power consumption:
- 9mA – ON mode
- 62uA – sleep mode
- 0,7uA – hibernate mode
Waspmote is sleeping most of the time, in order to save battery. After some minutes (programmable by the user), Waspmote wakes up, reads from the sensors, implements the wireless communication and goes again to sleep mode. Each device can be powered with rechargeable batteries and a solar panel, making the system very autonomous.
Deployment process
Typically, calibration is performed in certified laboratories and is a complex and expensive process. As such, it is not applicable in scenarios with hundreds and thousands of sensors, which could be also already deployed on different places. As the starting point for the sensors calibration in the system, some sensors have been calibrated very precisely. Their calibration is done in a laboratory, and all the other sensors are calibrated by comparison with reference sensors.
Waspmote, Gases Sensor Board, Sensors, GPRS and GPS devices were placed inside an enclosure to be able to be set on the roof of the buses. With such a position, constant reading of these parameters are performed whenever the vehicle is moving and in this way, data are collected from various locations. With the help of GPRS data communication, all readings are delivered to the server where it is processed and stored. Crossing sensors and GPS modules in the device provided values that were read at a certain location, and the current position of the vehicle, the speed of its movements.

Fig. 6.- EkoBus device which contains Waspmote
Once the sensor nodes have been validated by a large number of tests, they were deployed in two cities of Serbia, being divided in two groups of 60 and 5 sensors each one.

Fig. 7.- Waspmote placed on the roof of the buses
Sensor nodes make measurements and periodically send the results to the server application for further analysis and database storage. Web and Android application collect information from the nodes and perform their visualization (location of the vehicles and atmospheric measurements).
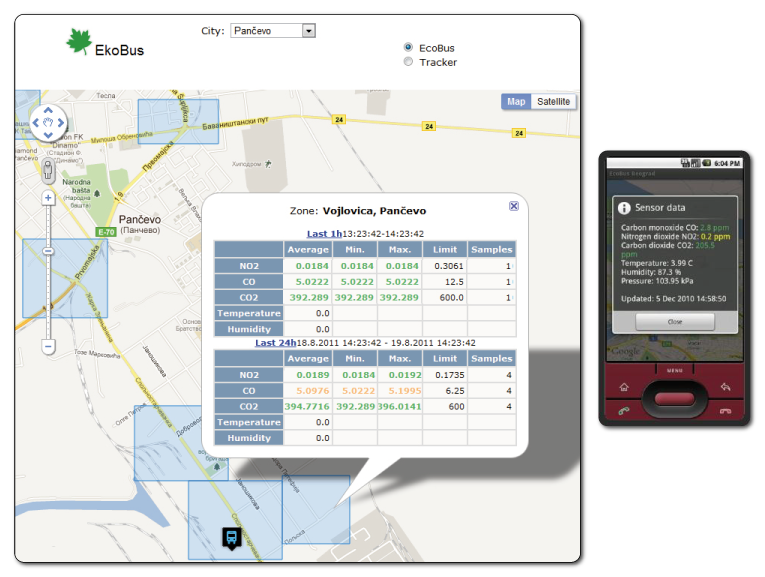
Fig. 8.- Web and Android application for monitoring environmental parameters
It is also possible to request information about the arrival time of the next bus on a certain line to a certain bus stop via SMS or USSD and to receive that information via SMS. The GPRS module is responsible for this feature.
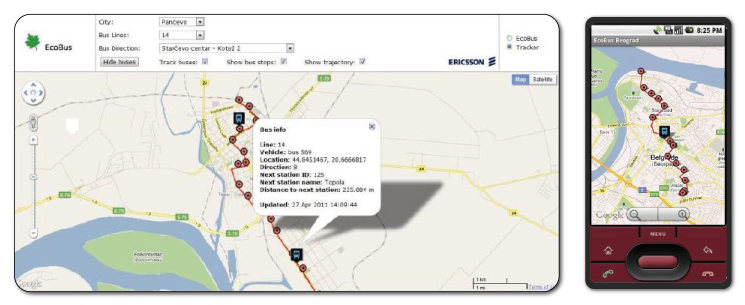
Fig. 9.- Web and Android application for monitoring bus location
Analysis of the stored data is used for various traffic calculation and prediction. Accordingly, additional information is available from the MYSQL database:
- Static data: geolocations and names of the stations, geolocations of curves and semaphores on the bus route, bus timetables, IMEI of the GPRS modules which are mounted on the buses, average time that bus spends at the specific station, initial average time of bus travel between two consecutive stations.
- Dynamic data: calculated average time of bus travel between two consecutive stations for the different part of day and week.
These nodes are powered by an external power supply connected to the bus battery. Taking advantage of Waspmote’s saving energy features and external, power supply these motes are autonomous.
As a result of this project, environmental parameters can be monitored for further study as well as citizens can take advantage of buses location.